
Highlight
ESG Impact & Financial Resilience: The Data Is Clear
Does strong ESG performance signal financial resilience? Our analysis of 11,000+ companies confirms it: higher ESG Impact scores align with stronger financial indicators and lower volatility. Europe leads on ESG Impact, with Portugal, Luxembourg, and Spain setting the standard. Communication Services, Utilities, and IT rank highest; Materials and Energy lag. Notably, larger companies have higher ESG ratings but worse controversy scores—a signal of reputational risk at scale.

New Tool: OECD Compliance Screening
Streamline portfolio due diligence with our new OECD Compliance Screening solution. Identify and monitor OECD-related compliance risks with precision, strengthen governance oversight, and align with international standards—all in one integrated framework.
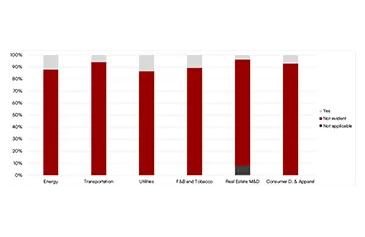
Biodiversity: A $125T Risk Investors Are Missing
Ecosystem services worth $125–145 trillion annually depend on biodiversity—yet only 9.2% of high-impact companies (food, energy, real estate, transport, apparel) report on biodiversity drivers. Even fewer set targets: 3–12% across sectors. Companies prioritize avoidance over restoration, lacking systematic assessments. As TNFD and SBTN frameworks mature, transparency and nature-positive strategies become non-negotiable.

Stewardship Delivers Results: 2025 Engagement Summary
100 companies engaged. 498 issues raised. 146 KPIs improved, 91 milestones achieved, 10 engagement objectives reached. Environmental and Social topics now represent 25% of engagement activity (up from 20% in 2020). Scope 3 emissions and Human Rights Due Diligence show strongest outcomes. Board competencies and remuneration integration remain priorities. Biodiversity and Psychosocial Risks at Work require continued escalation.

Climate Metrics Need Fixing
$5–7 trillion annually flows into climate transition, yet current metrics mislead. Carbon intensities hide valuation volatility and favor low-carbon sectors over necessary transitions in energy and materials. Fossil fuel exposure ignores 15–20% of non-energy emissions. ITR scores rest on unpredictable assumptions. Better approach: service-specific units, Scope 3 depth, and recognition of inter-sector dependencies—essential for harder-to-abate sectors like steel.