From trillions of raw data points to decisive investment insights, discover how our transparent, tiered architecture powers sustainable finance.
Foundational Data & Granular Metrics
Our foundation is built on a vast and diverse data lake, capturing thousands of raw metrics per company. This includes both reported data and insights derived from real-world outcomes. These granular data points are available as a direct data feed for seamless integration into your systems, serving as the bedrock for all subsequent analysis.

Environmental
GHG Emissions, Energy & Water Usage, Waste & Recycling, Pollutant Data, Resource Efficiency, Circularity.

Social
Employee Diversity, Turnover & Safety, Labor Relations, Supply Chain Human Rights, Community Engagement.

Governance
Board Structure & Diversity, Executive Pay (ESG link), Shareholder Rights, Anti-Corruption, Data Privacy, Tax Transparency.

Business Model & Products
Revenue by Product/Service, R&D in Sustainable Innovations, Product Lifecycle Data, Sustainable Revenue Share.

Auxiliary Data Sources
Real-time News, NGO Reports, Regulatory Filings, Industry Benchmarks, Satellite Imagery, Supply Chain Data.
Advanced Analytical Layers & Curated Datasets
Raw data is refined through our proprietary analytics engine, transforming it into structured, intelligent datasets for deeper analysis and compliance. These datasets can be subscribed to and utilized independently, offering flexible solutions for specific analytical needs.
Regulatory Alignment
Thematic & Impact Data
- Climate Impact & Transition Risk
- Biodiversity & Water Footprint
- Human & Labor Rights Analysis
Proprietary Scores
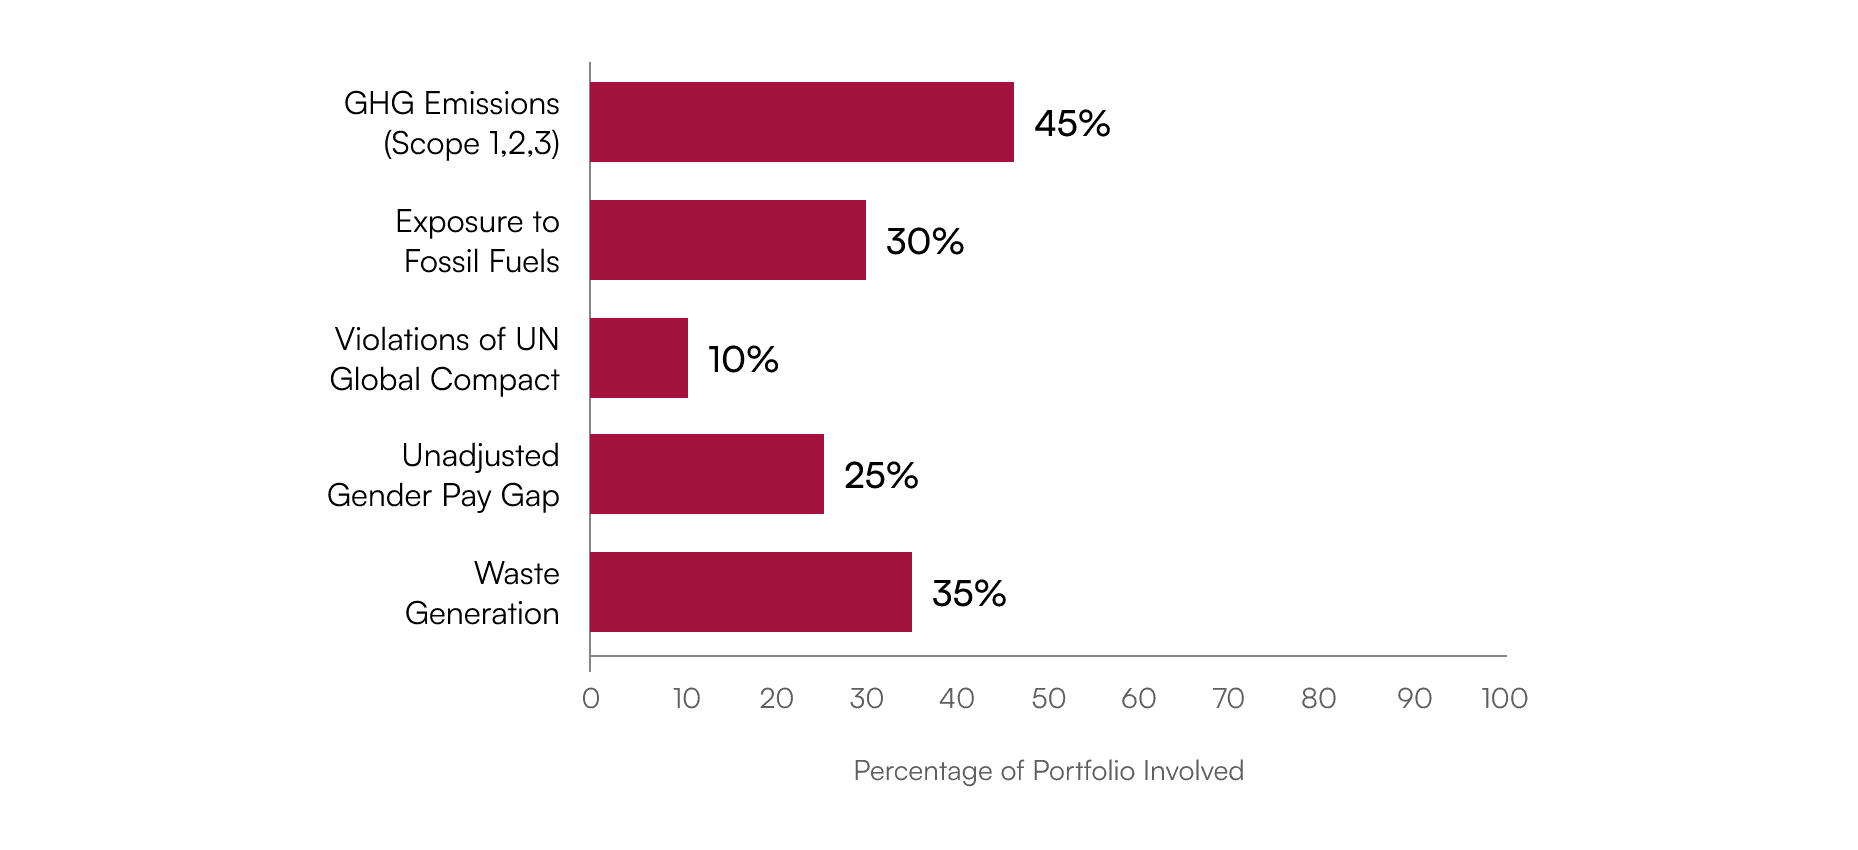
SFDR PAI Involvement Across Portfolio
Understand the percentage of your portfolio exposed to key Principal Adverse Impacts (PAIs), crucial for SFDR reporting and transparency.
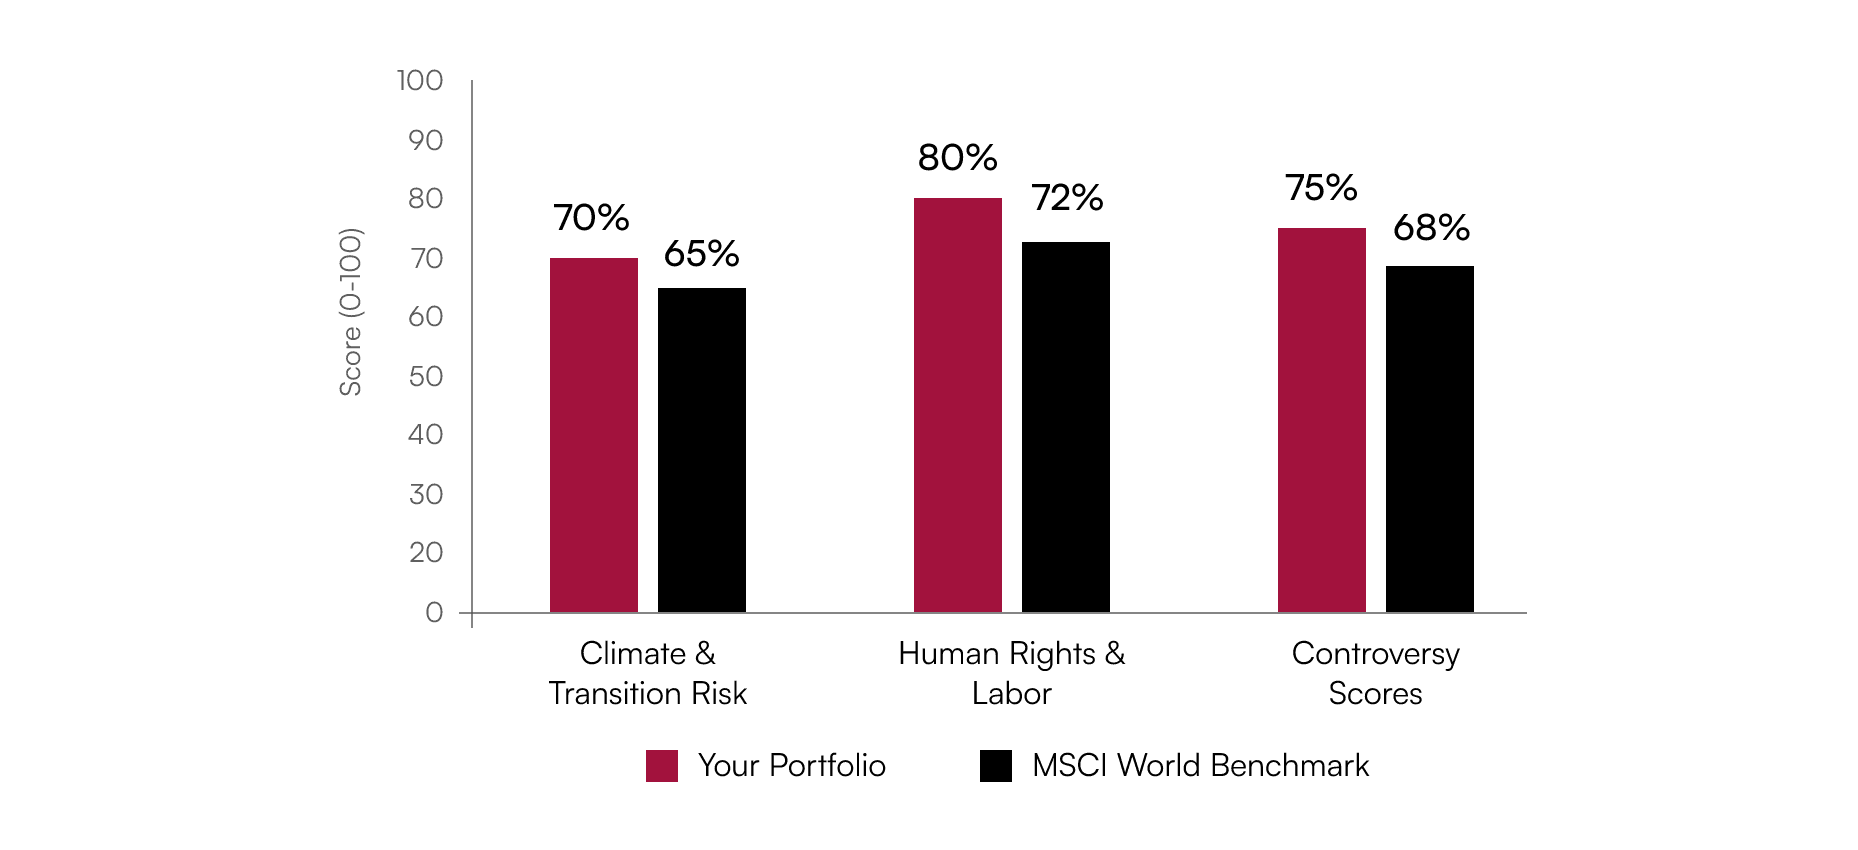
Thematic Performance vs. Benchmark
Compare your portfolio's performance against the benchmark across critical thematic areas like Climate & Transition Risk and Human Rights.
Strategic Insights & Flagship Solutions
Our flagship products translate complex data into clear, actionable insights, empowering confident investment decisions and transparent reporting. These strategic insights are fully deconstructible, offering unparalleled look-through to the underlying Foundational Data (Level 1) and Advanced Analytical Layers (Level 2). This ensures complete transparency and provides the detailed rationale needed for robust reporting and confident decision-making.
Overall ESG Ratings Distribution
Depicts the distribution of overall ESG ratings across your portfolio, using Inrate’s 12-point scale (D- = 1 to A+ = 12).

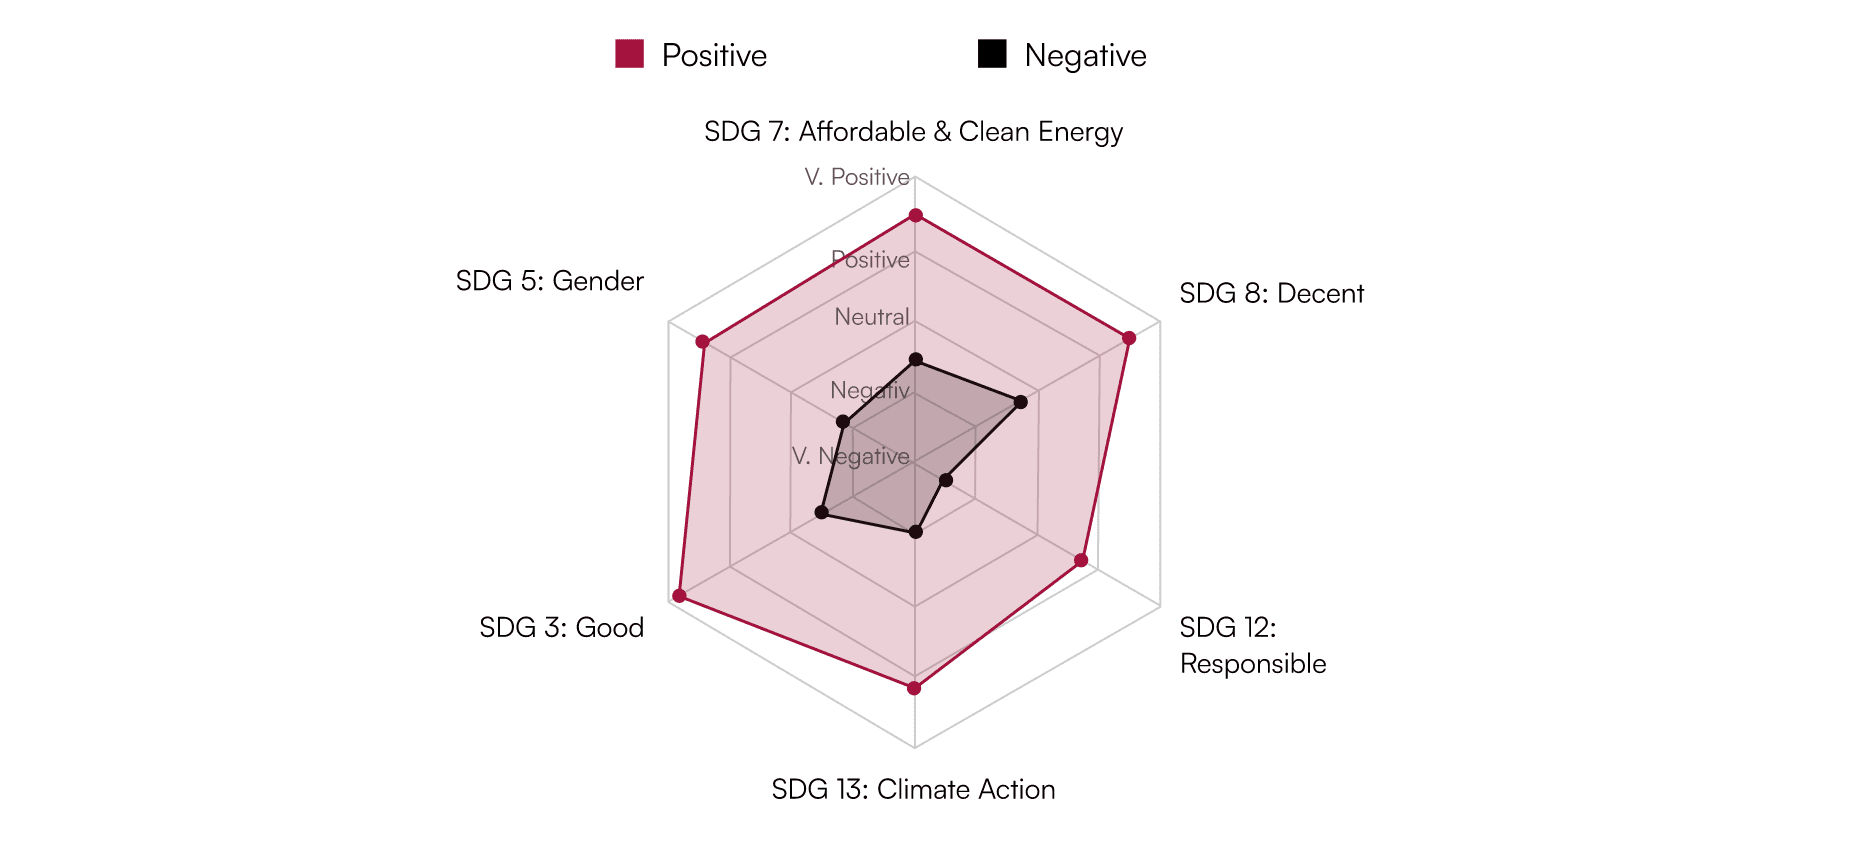
Company SDG Contribution
Inrate assesses both positive and negative contributions of a company's activities towards specific SDGs, providing a nuanced view of their overall impact on a -2 (Very Negative) to +2 (Very Positive) scale.
Combined Performance Distribution
A holistic view of portfolio companies' distribution across ESG, Environmental, and Social performance grades. Lower-scoring companies may indicate concerns across various material topics, such as GHG emissions, supply chain labor, water management, or data privacy, each culminating from multiple underlying indicators.
