

The FIFA World Cup 2026 is undoubtedly the most important sporting event of the summer. Held just once every four years, it brings fans together from every corner of the globe, creating a massive cultural and festive impact.
But the economic, financial, and social footprints of the tournament are just as significant. For the host countries, organizing the World Cup is a major investment project. The upfront capital poured into modern sports infrastructure is expected to pay off through long-term economic value in tourism, ticket sales, local consumption, and hospitality.
A Focus on World Cup Sponsors
In this blog post, we look at a less covered aspect of the tournament: the Sustainable Development Goal (SDG) contributions of the sponsoring companies.
The list of official sponsors includes prominent household names across diverse sectors, spanning consumer goods, financial services, and telecommunications. An event of this scale offers these brands an unparalleled stage for visibility, brand enhancement, and direct engagement with billions of customers.
Today, sustainability metrics are more highly scrutinized than ever at major sporting events. People are looking closely at water consumption, waste treatment, climate impact, and energy efficiency. Recent record-breaking heatwaves across the Northern Hemisphere have only intensified the global conversation around climate change, placing high-profile sporting events and their corporate backers under a bright spotlight.
What Are the SDG Profiles of Sponsoring Companies?
Given the sheer scale of the World Cup, the corporate sponsors tend to be massive multinational corporations. For these giants, sponsorship is part of a broader effort to build a positive global brand, which naturally includes robust sustainability and ESG reporting.
On the flip side, because they operate on a global scale, some of these companies may have business activities in high-risk sectors or countries, exposing them to unique operational and reputational risks.
To decrypt their sustainability profiles and analyse how they stack up against the UN’s SDG framework, we looked at the average performance of the 30 unique corporate entities sponsoring the tournament globally. This includes all three official sponsorship tiers: FIFA Partners, FIFA World Cup Sponsors, and Tournament Supporters & Official Suppliers.
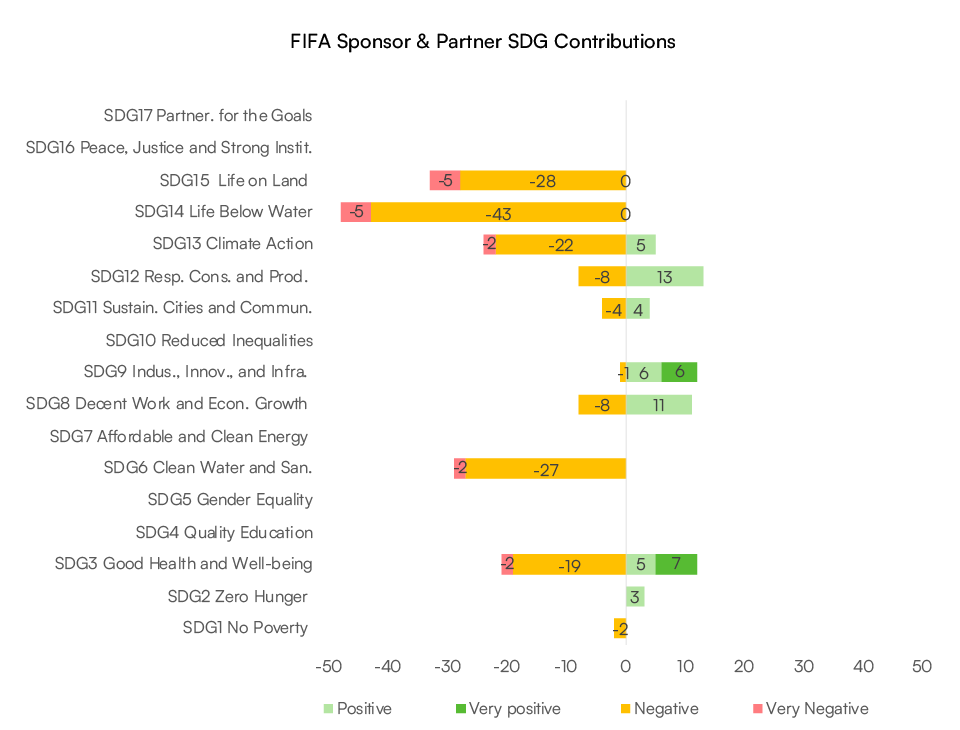
Figure 1 outlines the average contribution of these World Cup sponsors across each of the 17 SDGs. To measure this, a company’s revenue is broken down into five distinct impact buckets: very negative, negative, neutral, positive, and very positive. Only the portion of revenue directly relevant to a specific SDG is taken into account. Furthermore, if a specific SDG is not material to a company’s core business, it is left unassessed.
What the Data Tells Us?
Overall, the data reveals a mixed picture. On the bright side, these sponsors are driving clear positive impacts in several key areas. This includes SDG 12 (Responsible Consumption and Production) with a +13% positive contribution, SDG 9 (Industry, Innovation, and Infrastructure) with 6% very positive and 6% positive, and SDG 3 (Good Health and Well-being) showing 7% very positive and 5% positive.
On the flip side, there are clear areas of concern that leave significant room for improvement. SDG 14 (Life Below Water), SDG 15 (Life on Land), and SDG 6 (Clean Water and Sanitation) report notable negative impacts of 43%, 28%, and 27%, respectively.
The silver lining is that “very negative” impacts remain rare—rarely exceeding 5% and occurring only within a small handful of companies.
What is driving this negative performance?
Primarily, it comes down to the core nature of these companies’ business activities. For instance, massive beverage companies often consume heavy amounts of freshwater resources and generate vast amounts of plastic waste, while their products can also face scrutiny regarding public health and nutrition. Similarly, heavy industrial or technology partners rely on rare mineral extraction, which leaves a heavy footprint on local ecosystems and the climate.
Neutral Contributions Account for a Large Share
It is also worth noting that this group of sponsors has virtually no measurable impact on several goals, such as SDG 17 (Partnerships for the Goals) and SDG 16 (Peace, Justice, and Strong Institutions). Corporate contributions to SDG 5 (Gender Equality) and SDG 4 (Quality Education) are also largely absent from the data.
Although it isn’t visually dominant in the chart, “Neutral” remains the single largest revenue bucket, making up an average of 19.6% across all SDGs. This represents a massive window of opportunity. With the right strategic pivots and sustainability initiatives, these companies could eventually convert these neutral footprints into meaningful, positive contributions.
Figure 1: SDG Revenue Contributions of World Cup Sponsors
Source Inrate
Inrate SDG Framework: Assessment Focus
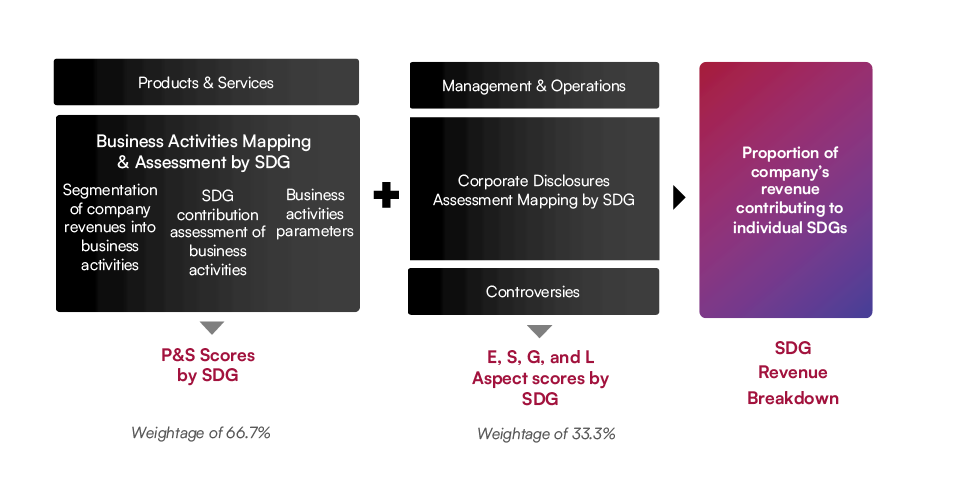
Inrate assesses a company or portfolio’s impact on SDGs by analyzing the positive or negative contributions of its business activities. This evaluation considers how each business activity affects individual SDGs. It considers potential substitution effects and encompasses the entire value chain of the activity. In addition, we use company-specific parameters for better differentiation within the same activity. Finally, we consider the contributions of management & operations (Corporate Social Responsibility, CSR thereafter), and controversies to individual SDGs.
Know more: About Inrate’s SDG framework
Assessment Boundaries
The assessment considers the entire life-cycle of products and services as well as substitution effect of the business activities of companies. It also evaluates the overall Environmental, Social, Governance, and Labour (E, S, G, and L) performance (captured with the aspect scores) — including corporate social responsibility (CSR) practices and any associated controversies.
FAQ - World Cup Sponsors SDG Impact
1. What are the Sustainable Development Goals (SDGs)?
The SDGs are a set of 17 interconnected global goals adopted by the United Nations in 2015 to address universal challenges such as poverty, inequality, and climate change. They provide a framework for aligning business activities with broader societal and sustainability objectives.
2. How does Inrate assess the SDG impact of companies?
Inrate breaks down a company’s revenue into standardized business segments and maps them against specific SDGs, assigning scores based on value-chain impacts and substitution effects. This base rating is then weighted alongside the company’s operational CSR practices and verified corporate controversies.
3. Why are FIFA World Cup sponsors evaluated against the SDGs?
Because the tournament has massive economic, financial, and social footprints, its multi-sector global sponsors are heavily scrutinized on sustainability metrics like water usage and climate impact. The evaluation decrypts whether these massive corporations are truly aligning their business models with sustainable practices.
4. Which SDGs show the strongest positive and negative contributions among World Cup sponsors?
The strongest positive contributions are seen in SDG 12 (+13% positive), SDG 9, and SDG 3. Conversely, the most significant negative impacts are reported for SDG 14 (43% negative), SDG 15 (28% negative), and SDG 6 (27% negative).
5. Why is SDG analysis important for investors and asset managers?
It delivers robust, data-driven insights that go beyond conventional ESG metrics to help build portfolios aligned with global sustainability objectives. This transparent analysis ultimately facilitates impactful reporting, enhanced stakeholder communication, and stronger trust.