
The 2026 World Cup is ending this week. The event has brought immense joy and festivity across all continents, uniting nations and people for the duration of the competition.
Against this backdrop, the underlying economic significance is never far behind. The tournament is given the highest priority by all participating countries, as football performance inherently mirrors and projects a nation’s global image.
Sport and Economics
In the minds of many, athletic success is frequently conflated with economic development. Consequently, officials are increasingly investing resources to prepare their teams and advance as far as possible in the tournament.
Highlighting this connection between economic development and sporting success, a recent article in the Financial Times (FT) i analyzed the link between a country’s GDP and its number of World Cup goals. Interestingly, they found a positive correlation between economic development and performance on the pitch. With a few notable exceptions, economic development appears to provide the infrastructure, robust investment, and financial means necessary to achieve better competitive results.
Beyond Economics: Sport and ESG Country Ratings
We extend this idea to the sovereign ESG landscape, which covers both financial and non-financial dimensions.
Financial aspects provide the foundational capital required to support sporting infrastructure and fund development programs.
Meanwhile, non-financial components capture vital qualitative elements, such as social dimensions (access to education, healthcare, and gender equality) and environmental conditions (air pollution mitigation, waste management, life below water, life on land, and biodiversity protection). These structural factors are highly likely to foster a favorable, healthy environment where a larger base of young talent can thrive, ultimately contributing to more competitive national teams.
Know more: about Inrate’s Sovereign rating
What Does the Data Tell Us?
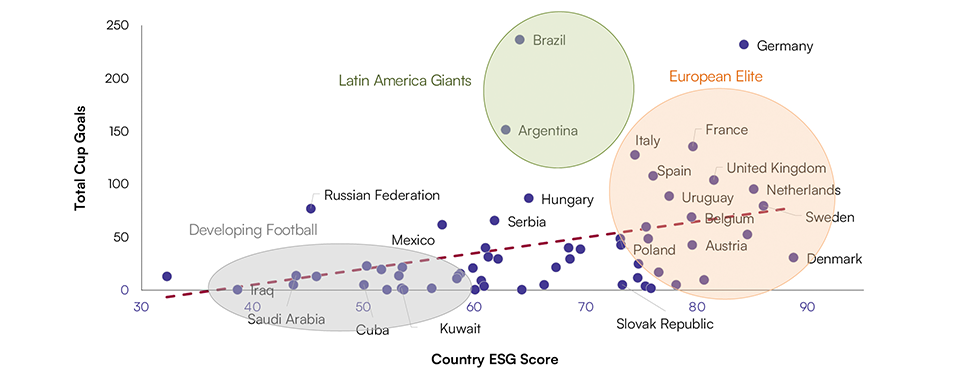
Confirming our intuition, the correlation appears relatively strong. A country’s total historical World Cup goals correlate at approximately 38% with its Inrate Sovereign ESG score (scaled from 0 to 100). Based on our sensitivity analysis, a 5-point increase on the standard 0–100 ESG scale translates to an additional 7.5 historical goals. Perhaps it is well worth the investment?
At the top of the chart, a prominent cluster led by Germany, Italy, France, and England outperforms the rest, boasting both high goal counts and superior sovereign ESG scores. On the other end of the spectrum, some nations register modest performances across both metrics, such as Saudi Arabia, Iraq, and Jamaica.
Two marked anomalies stand out among the footballing giants: Brazil and Argentina. For both nations, legendary sporting performance significantly outpaces their mid-tier ESG metrics. Conversely, several countries maintain exceptionally high ESG standards yet fall below expectations in historical World Cup goals, such as Denmark.
Figure 1: ESG Sovereign Score and Historical World Cup Goals: Country-level Analysis
Grouping Results by Region
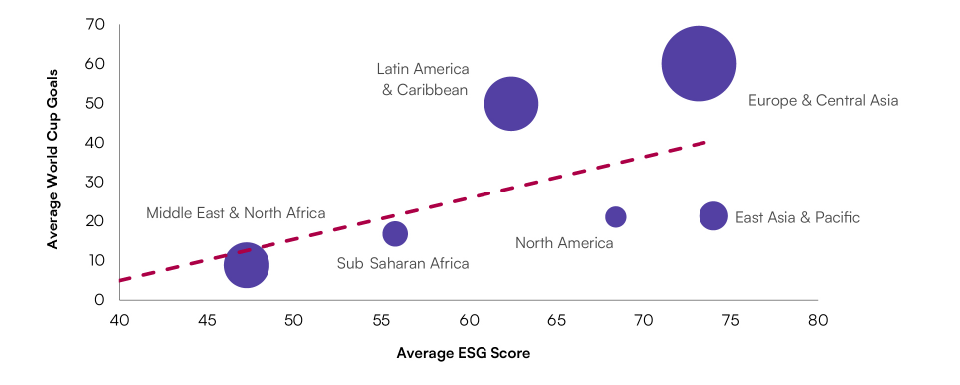
The country-level analysis reveals stark differences between developed and emerging economies. To investigate further, we computed the average ESG scores and historical goals across major geographic regions. Figure 2 reports the results. Europe & Central Asia tops the matrix, pairing the highest average goal count (60.0) with a highly competitive average ESG score (73.16). Conversely, the Middle East & North Africa region underperforms on both metrics.
The High-Performance Cluster: Europe & Central Asia represents the largest cluster in our sample with 27 countries, dominating the goals category (60.0) while maintaining a strong institutional ESG baseline (73.16).
High Sustainability, Fewer Goals: East Asia & Pacific achieves the highest overall average ESG score (74.01) across its 4 sample countries, though its historic World Cup goal count (21.3) remains moderate.
The Football Powerhouse: Latin America & Caribbean holds a strong second position in average goals (49.8) across 14 countries, driven by a rich athletic culture despite a mid-tier regional ESG average (62.42).
Emerging Regions: The Middle East & North Africa and Sub-Saharan Africa populate the lower-left quadrant, indicating lower relative averages in both historic goals and ESG compliance within this specific dataset.
Figure 2: ESG Sovereign Score and Historical World Cup Goals: Region-level Analysis
OECD vs. Non-OECD Members
Our final comparison categorizes countries by their OECD membership status. While this indicator is largely economic, it inherently embeds vital social and institutional frameworks. Table 1 reports the results.
Table 1 OECD vs. Non-OECD Members Comparison
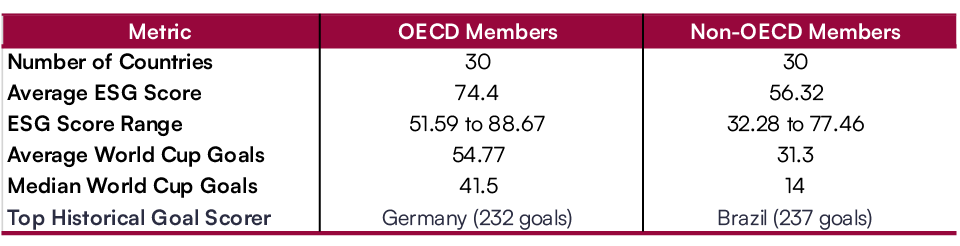
Socioeconomic Advantage: On average, OECD member states score significantly higher on the ESG index (+18.08 points). This reflects structural concentrations of institutional resource development, environmental regulation, and robust social safety nets.
The Baseline Performance Gap: OECD countries score nearly 75% more goals on average (54.77 goals) than non-OECD countries (31.30 goals). The median gap is even wider (41.5 vs. 14.0), demonstrating that highly developed economies generally possess more continuous structural funding to qualify for and excel in international tournaments over multiple decades.
Limitations of Our Analysis
A notable limitation of this analysis is the presence of binational players. Many athletes choose to represent a country despite having primarily benefited from the youth infrastructure and socioeconomic support of another nation. However, even in these instances, we contend that a favorable financial and institutional environment in the home country heavily influences a player’s long-term decision to commit to that national team.
Another limitation pertains to causality. The athletic developmental channel we outline requires substantial time to materialize into concrete tournament results. Because both sovereign ESG scores and World Cup goals represent cumulative performances built over decades, our statistical analysis is strictly limited to measuring co-movement via correlation. Formal causal inference modeling would be required to verify the exact directional robustness of these findings. However, the reverse relationship is unlikely, especially in the short term: scoring goals in the World Cup will not shift a nation’s ESG score.
Finally, this analysis is just a first step toward proving the positive link between national ESG ratings and sports performance. While the ESG index already aggregates about one hundred indicators (implicitly controlling for these variables), future research should control for other unobserved country-specific characteristics.
Inrate’s Country Rating: Assessment Structure and Boundaries
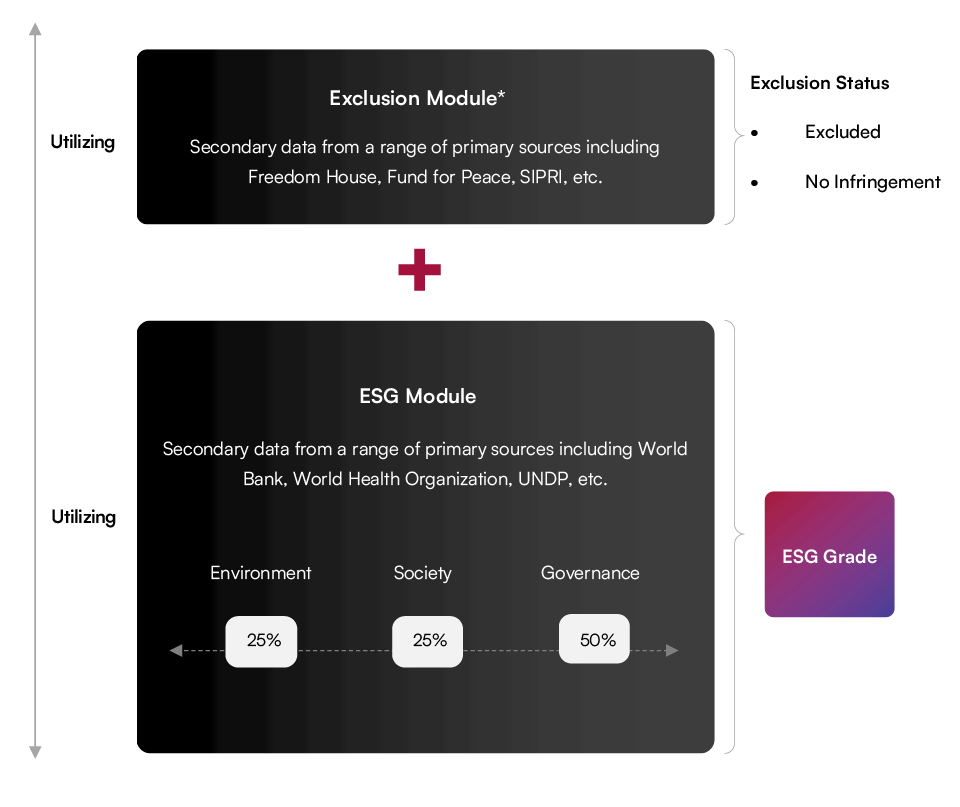
Inrate evaluates a country’s contribution to sustainable development by assessing the material aspects over which a government has direct influence. This evaluation is built upon two distinct structural pillars: an Exclusion Module and an ESG Module.
The Inrate Sovereign Rating applies the following relative weights to its three core pillars: Environmental (E): 25%; Society (S): 25%; Governance (G): 50%.
The higher weight assigned to Governance reflects a core methodological principle: an intact, transparent governance framework is considered an essential precondition for achieving sustained, high-quality social and environmental performance. The country rating’s outcome comprises the definitive status of the Exclusion Module (‘no infringement’ or ‘excluded’) alongside a standard ESG letter grade ranging from A+ to D- and a 0-100 scale.
Figure 3: Country rating assessment structure